
There are many parts to a high-performing sales organization – the right people, processes and strategy, to start. But today, the underlying backbone of all of it is the right data as a foundation for customer acquisition.
That’s not to say there’s no art to practicing sales. Much of what defines our most outstanding sales reps is their ability to deeply understand our prospects’ and customers’ business needs and speak directly to them. They often care about far more than just their sales quota. While science has always been part of sales, it’s hard to ignore the increasing importance of taking a data-driven approach to growing your business.
As a sales leader, that means you have to be able to interpret and use data about your team and organization throughout the sales cycle. As a sales rep, you need to be comfortable understanding the data behind your pipeline. For both, it’s the ability to turn numbers like lead volume, win rates and ARPA into an actionable plan that impacts the bottom line. If you’re forecasting short on your global revenue target, do you know how you’ll make up the difference? That’s not a rhetorical question.
The best way to gain this visibility is through clearly defined sales KPIs. Here’s a look at the sales KPIs we track at Intercom and how we use them to drive key outcomes.
What are sales KPIs?
Sales KPIs, or Key Performance Indicators, are a series of agreed-upon, quantitative measures used to assess the performance of a sales organization. KPIs help sales reps, managers and leaders track progress to targets, identify high-level trends and themes, and manage individual and team performance.
Sales KPIs versus sales metrics
Some might argue that there are fine-grained distinctions to be made between KPIs and metrics. In my world, they’re just two sides of the same coin. You can think about it this way: your KPIs are the key metrics you use to measure sales performance.
Beware of headline KPIs
When you’re first defining your sales KPIs, it can be tempting to focus all of your attention on headline KPIs like organizational or individual attainment. After all, the end goal of any sales organization is to bring in more money for the business. While headline KPIs are a concise way of understanding where you’ve netted out, they rarely provide the full picture of how or why you hit (or missed) your targets in Salesforce.
“The point of tracking sales KPIs is to drive action for our team, not just to display them on a sales dashboard”
That’s why I spend much of my time examining underlying KPIs like lead flow, pipeline creation, churn, expansion and more. The point of tracking sales KPIs is to drive action for our team, not just to display them on a sales dashboard. For example, say that I notice we’re over delivering on sales eligible leads but our number of stage one opportunities – new leads that our Sales Development Representatives (SDRs) mark as qualified and pass to our Account Executives (AEs) – hasn’t increased. I can interpret that in one of two ways: either we have more leads of poorer quality, or we haven’t staffed up our SDR team to convert the increased volume. Both can be corrected to get us up and over the line.
The 18 top sales KPIs and metrics
Below I break down the top 18 sales KPIs that we track here at Intercom. The KPIs are organized by category with more detail on how we calculate and use each sales metric. Here are the 18 sales KPIs and metrics we’ll cover:
- Sales eligible lead delivery
- First response time
- Number of accounts contacted
- Number of accounts engaged
- Stage one opportunity creation
- Stage two opportunity creation
- Average revenue per account
- New logos acquired
- New logo revenue
- New business win rate
- Expansion dollars
- Contraction dollars
- Churn dollars
- Gross customer churn
- Net expansion revenue
- Net new revenue attainment
- Individual quota attainment
- Revenue sold per rep
6 types of sales metrics (and the best KPIs for each)
While there are infinite metrics we could track and many more that we do track, these are the ones we feel are critical to driving growth and efficiency.
For many of these KPIs, you’ll want to measure them on two levels: individual and team. Both are important if you want to manage your sales reps to top performance and ensure your team is on track to hit company goals.
1. Lead generation KPIs (Top of funnel)

Our lead flow KPIs tell us the volume of leads entering the sales funnel. These top of funnel KPIs are leading indicators of how many opportunities we can expect our SDRs to hand off to our AEs.
For our inbound leads – new leads that are generated by marketing activities – we track:
-
Sales eligible lead delivery
The total number of inbound leads across all channels that are passed from the marketing team to sales based on shared qualification criteria. As you can see in the chart above, we segment inbound leads by business type – small business, mid-market and enterprise – to ensure we’re delivering the right number of leads to each of our teams. This KPI is also referred to as Marketing Qualified Leads (MQLs).
-
First response time
The amount of time in minutes that it takes SDRs to follow up with inbound leads. It’s no secret that time kills all deals, and that’s why we use live chat to convert as many leads in real time as possible.
For our outbound leads – leads generated by our outbound SDRs – we track:
-
Number of accounts contacted
The total number of companies that our outbound SDRs have prospected to. One company might have multiple points of contact.
-
Number of accounts engaged
The total number of companies that have responded to our outreach. It’s critical that the SDR and AE teams agree on what level of contact is required before the account is converted to a sales opportunity.
At this stage, many companies become obsessed with tracking sales activities, especially if they’re doing outbound sales. While I agree there’s value in tracking activities like number of calls made or emails sent, you can’t hang your hat on a seventeen-part cadence and having your SDRs call it 17 activities. Your SDR leaders need to be able to put these key inputs in the context of driving the right outcomes.
2. Pipeline creation KPIs
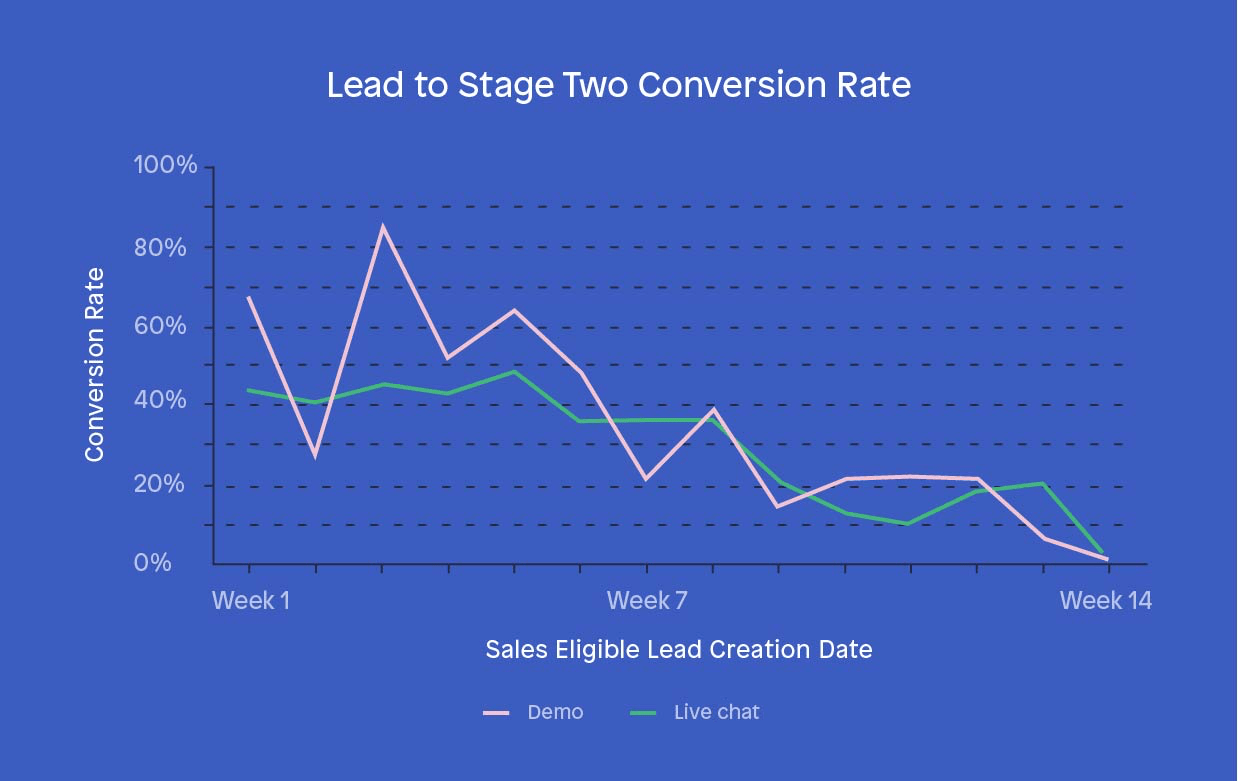
Our pipeline creation KPIs help us gauge the health of our sales pipeline. We’re focused on the first two stages of our pipeline because they reflect the number of high quality deals we’re working. If we see an increase or decrease in stage one or stage two opportunities, we can reasonably expect our revenue to follow.
Because they’re important predictors of how much revenue we can expect to close, we track the conversion rate of leads to stage one and stage two opportunities on a weekly, monthly and quarterly basis. We use cohorting to understand how our conversion rates change over time. That also means conversion rates will always be lower for newer cohorts – in the graph above, those are the cohorts closest to week 14 – because not all leads that will convert have yet.
Here’s how we define stage one and two opportunities:
-
Stage one opportunity creation
For inbound SDRs, this is the percentage or number of sales eligible leads that they have converted into sales opportunities. For outbound SDRs, this is the percentage or number of sales opportunities they’ve created through their proactive outreach.
-
Stage two opportunity creation
The percentage or number of stage one sales opportunities that are marked as qualified by AEs. Ideally, the vast majority of your stage one opportunities convert to stage two. If this number is really disconnected, you may need to revisit the qualification criteria that your SDR and AE teams have agreed on. This KPI is also referred to Sales Qualified Leads (SQLs).
3. New business KPIs

Our new business KPIs measure the growth we’re driving for the company by acquiring new customers. While our ultimate goal is to have these numbers go up and to the right, it’s important to remember some of these are lagging indicators of how well we’ve built up and closed our sales pipeline. By the time we see changes here, it’s far harder to course correct than if we spot changes earlier in the sales funnel. Here’s what we’re tracking:
-
Average revenue per account (ARPA)
The average revenue per customer upon close. As you can see in the chart above, we track ARPA by business segment and unsurprisingly, the further you move upmarket, the larger your ARPA. This KPI is also called Average Sales Price (ASP) or Average Transaction Size (ATS).
-
New logos acquired
The number of new customers that you’ve closed.
-
New logo revenue
The additional revenue generated by new customers.
We also track new business win rate. This is a measure of how efficiently our AEs are turning qualified opportunities into new revenue. Here’s how we define it:
-
New business win rate
The percentage of stage two opportunities that are converted by AEs to new customers.
There are two important things to remember when calculating your win rate. The first is that your win rates will look very different between your inbound and outbound opportunities and by business segment, so you should track each of these separately. Take your inbound and outbound opportunities, for example. Your inbound opportunities are your hand raisers and as a whole, they’ll have much higher win rates than your outbound opportunities.
The second is that you’ll need to measure your win rate on a cohorted basis. Otherwise you’ll see constant fluctuation as your pipeline matures and sales processes change. An alternate approach is to track your win rate on a rolling basis. If your sales cycle is 60 days on average, you might look at your win rate on a rolling 60-day basis. The goal of both approaches is to establish a reliable win rate on an organizational level.
4. Existing business KPIs

Our existing business KPIs measure how effectively we’re getting current customers to spend more money with us. Retention and expansion are key to our strategy for driving sustainable revenue growth. It’s anywhere from five to 25 times more expensive to acquire a new customer than to retain an existing one.
That’s why we keep a close eye on churn, contraction and expansion trends to make sure we’re constantly delivering value to our customers. The obvious goal is for expansion to always exceed churn and contraction as we’ve modeled in the graph above.
Here’s how we define our existing business metrics and KPIs:
-
Expansion dollars
The additional revenue from existing customers who have increased their spend.
-
Contraction dollars
The loss in revenue from existing customers who have reduced their spend.
-
Churn dollars
The loss in revenue from existing customers who have stopped their spend.
-
Gross customer churn
The number of customers who have churned. Together churn dollars and gross customer churn allow you to understand patterns in customer behavior. Are you seeing a handful of large churn events or many small churn events across your customer base?
-
Net expansion revenue
The total additional revenue generated by existing customers who have increased their spend, less any revenue contraction or churn.
5. Organizational attainment KPIs

Our organizational attainment KPIs reflect our overall contribution to the business’s revenue growth. As a sales leader, net new revenue is my north star. It combines the revenue we’ve generated from closing new business, or new logo revenue, with the net expansion revenue we’re seeing from investing in existing business. Here’s how we define it:
-
Net new revenue attainment
The total additional revenue generated by new customers, less any contraction or churn and plus any expansion revenue from existing customers. This includes the percentage of the revenue plan that was actually achieved.
6. Individual performance KPIs

The goal of individual performance KPIs is to understand the impact of each sales rep relative to their on-target earnings (OTE). Taken together, these KPIs reveal how productive your sales team actually is. It helps you understand how efficient you are at allocating headcount and how effective your reps are at hitting quota. Here are the two KPIs that we track:
-
Individual quota attainment
The percentage of quota that a sales rep has achieved (This chart should be self-explanatory 😉). We also track the percentage of reps on each team and across the organization that achieve quota.
-
Revenue sold per rep
The actual sales that a rep has closed. This is a basic ROI metric when paired with the fully loaded cost for each rep.
Quota attainment and revenue sold per rep are measured differently for AEs, SDRs and relationship managers (RMs). For AEs, it’s new business revenue and for SDRs, it’s the number and size of stage two opportunities. For RMs who are focused on existing business, it’s net expansion revenue.
How to drive key outcomes with sales metrics
Defining your sales KPIs is an important start, but KPIs alone can’t take your business to the next level of sales growth. As I mentioned earlier, it’s how you apply them and the actions they inspire that make KPIs so valuable to any sales organization. Here are two very different examples of how we’ve used sales KPIs as strategic levers.
Example #1: Secure executive buy-in
To be an effective sales leader, the work of your sales organization has to bubble up to what the company wants to accomplish at the highest level. You have to be competent at translating your sales KPIs into new initiatives that make sense to the entire executive team.
“You have to be competent at translating your sales KPIs into new initiatives that make sense to the entire executive team”
Recently, we saw an opportunity to test outbound sales as a way to move upmarket and increase our global revenue. In theory, it’s simple: Hire a few outbound folks and start selling to larger companies. But the math also has to work out. You need to work with your finance team to establish the ROI metrics and appropriate timelines. That way, you can say to your peers, “The target is to have an ROI of 4X on each outbound SDR, and it’s forecasted that we’ll achieve that run rate in no more than 12 months.”
The inputs that define your outbound initiative are your sales KPIs – the number of opportunities created per head, win rate, net new revenue and average revenue per account. Together these numbers are your game plan for how and why outbound sales makes sense for your business. You can only do this kind of executive expectation setting with the right data.
Example #2: Turn product launches into revenue
Often when people think about product launches, they think about building and shipping new features. But what comes after – how you market and sell it – is just as important, and our sales team play an important role in ensuring the investment we make in our product pays off in the market.
When we launched Custom Bots, our conversational marketing chatbot, we set a specific target for net new revenue. For our relationship managers, that trickled down to an amount of pipeline they had to build for Custom Bots among their book of existing customers. By creating a dedicated KPI, we’re able to ensure that our investment in our product has a positive financial impact and that the launch is maximized across the company.
“By creating a dedicated KPI, we’re able to ensure that our investment in our product has a positive financial impact”
Whenever you have a new initiative, whether it’s a new feature, plan type or focus area for the company, you have to be able to come up with clear monthly sales KPIs for your sales team.
The power of data in sales
The value of having the right sales KPIs can’t be understated – whether you sell online or offline, SaaS or physical products, B2B or B2C. For ambitious companies, monitoring the right metrics is the difference between driving scalable growth and seeing your revenue flatline. Put bluntly, if you’re not a data-driven sales leader or sales manager, you’re in trouble. But KPIs on their own are just numbers on a dashboard. They only become meaningful when you dig deeper, start looking for underlying trends and themes, and use those insights to take the next step toward faster growth.